
 Local government
Mount Nelson, Tasmania
Mount Nelson prescribed burn
A planned burn above Hobart, modelled before it happened — and the follow-up treatment the model says should come next.
−40%Average fire size
Wildfire risk, quantified
Mitigate simulates bushfire across your landscape, tests every mitigation option against the same fires, and tells you how much risk each one removes — and what it costs.
Ultra-high resolution·8-hour to multi-day simulations·Ensemble runs·Global
Companies we're proud to support


Measured, not asserted
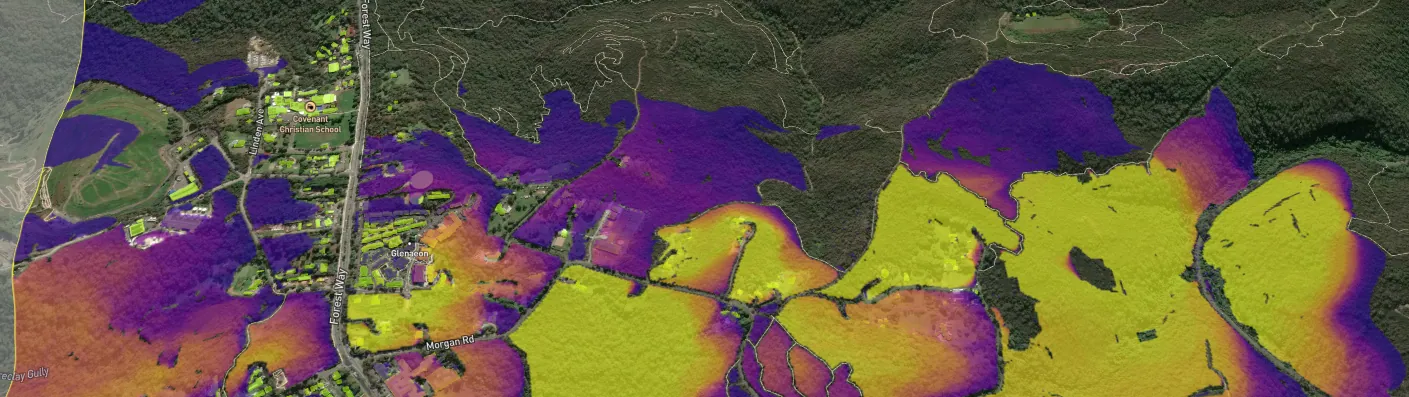
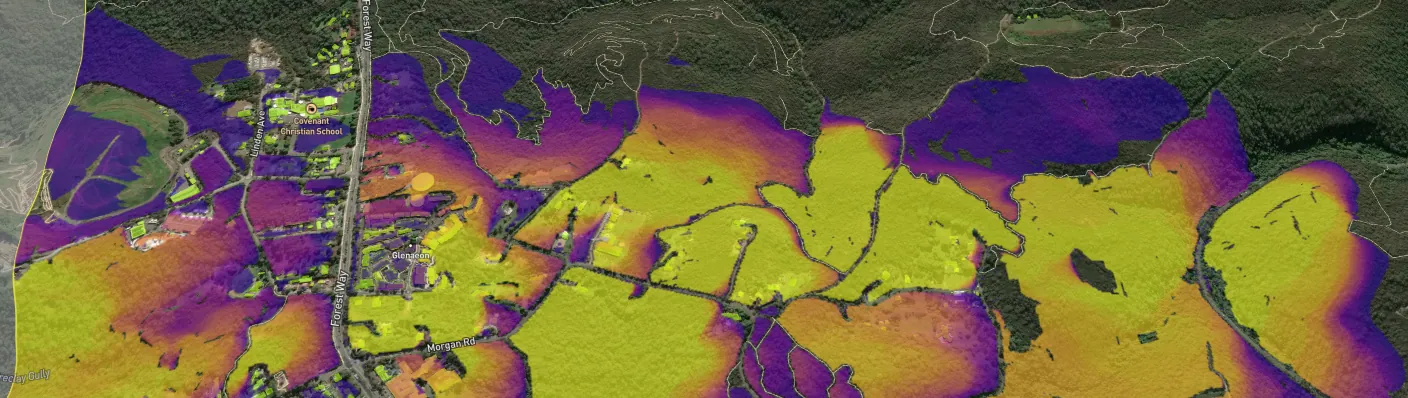
We rebuilt the Coolagolite fire weather of 3 October 2023 across the New South Wales Far South Coast and ran 729 ignitions twice — once over the landscape as it stood, once with the 2026 hazard reduction burns inserted exactly as they were laid down.
Fewer homes, sheds, powerlines and structures inside lethal intensity contours.
Average across every ignition tested.
Per ignition, against the untreated landscape.
13,105 mapped assets across the planning area.
Source: FiSci Mitigate analysis of the FCNSW / RFS / NPWS autumn 2026 hazard reduction programme, modelled under 3 October 2023 conditions. Full method in the field note.
The comparison
Drag the divider. On one side, the landscape as it stands. On the other, the same country after a thinning and prescribed burn programme. Yellow marks the ground most likely impacted by fire.
How it works
Thousands of ignitions run across your real landscape — fuel, slope, aspect, weather — at ultra-high resolution. Eight hours to several days of physical fire behaviour per ignition.
Build treatment strategies from burns, thinning, grazing and mechanical work. Every block is costed, scheduled and placed against the fires that actually threaten you.
Re-run the same ignitions over the treated landscape. The difference between the two runs is what your programme bought — in hectares, in assets, in dollars.
What sets Mitigate apart
Evidence
Local governmentMount Nelson, Tasmania
A planned burn above Hobart, modelled before it happened — and the follow-up treatment the model says should come next.
−40%Average fire size
 Forestry
Maryborough, Queensland
A live fire near Maryborough, a sixteen-hour forecast, and an incident action plan built on it — with no impact on the mill or the plantation.
16 hrsForecast window
 Urban interface
Oxford Falls, New South Wales
A 23-hectare hazard reduction became a 147-hectare bushfire. We re-ran it, then built the burn strategy that should have been used.
11% → 2%Post-burn risk
Who we work with
Turbines, mills, plantations, transmission corridors, carbon estates, towns. The question is always the same: what will the fire do, and what should we spend to change it?
Bring us a boundary and a bad day. We'll show you what the fire does, and what your programme is worth against it.